TradingView Position Size Calculator: What the Long/Short Position Tool Shows and What It Leaves Out
TradingView already has a position size calculator: the Long Position and Short Position drawings. They size a trade as risk ÷ (entry − stop), capped by account size × leverage ÷ entry, and they leave out trading fees and the liquidation price. The calculator below shows TradingView's quantity next to a fee-inclusive one for the same inputs.
Where is the position size calculator in TradingView?
- Open a chart and look at the drawing toolbar on the left. The group labelled Forecasting lists Long position and Short position.
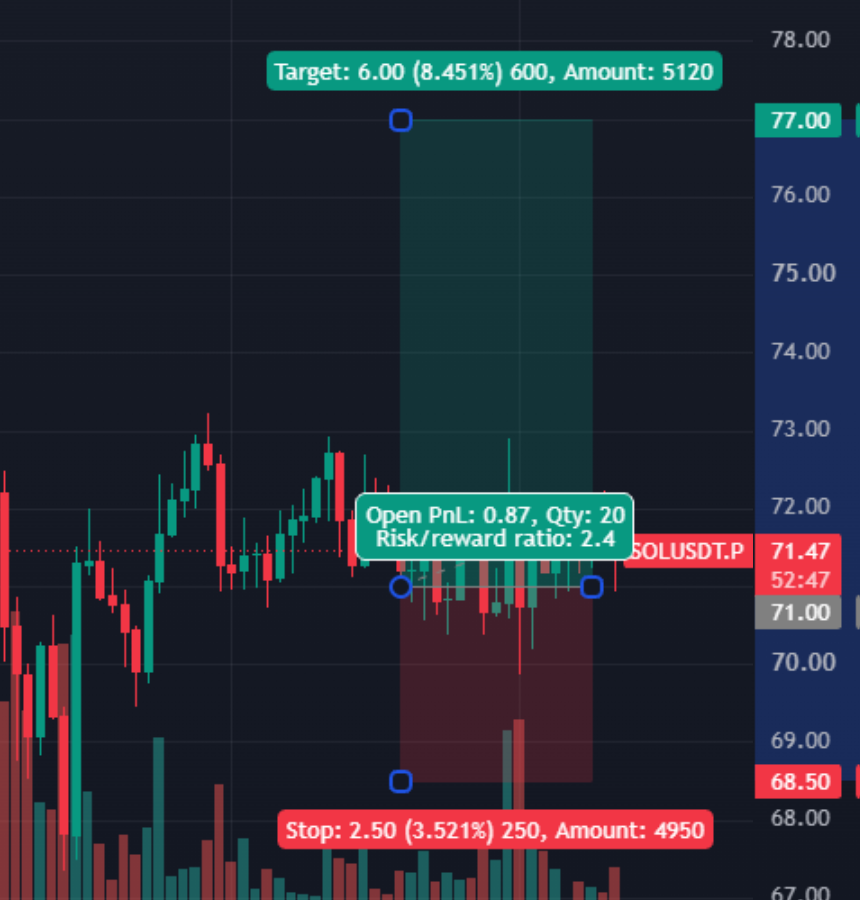
- Pick Long position or Short position and click the chart at your entry. The drawing has a profit zone on one side of the entry line and a loss zone on the other. Move the target and stop by dragging them or by typing the levels in the settings.
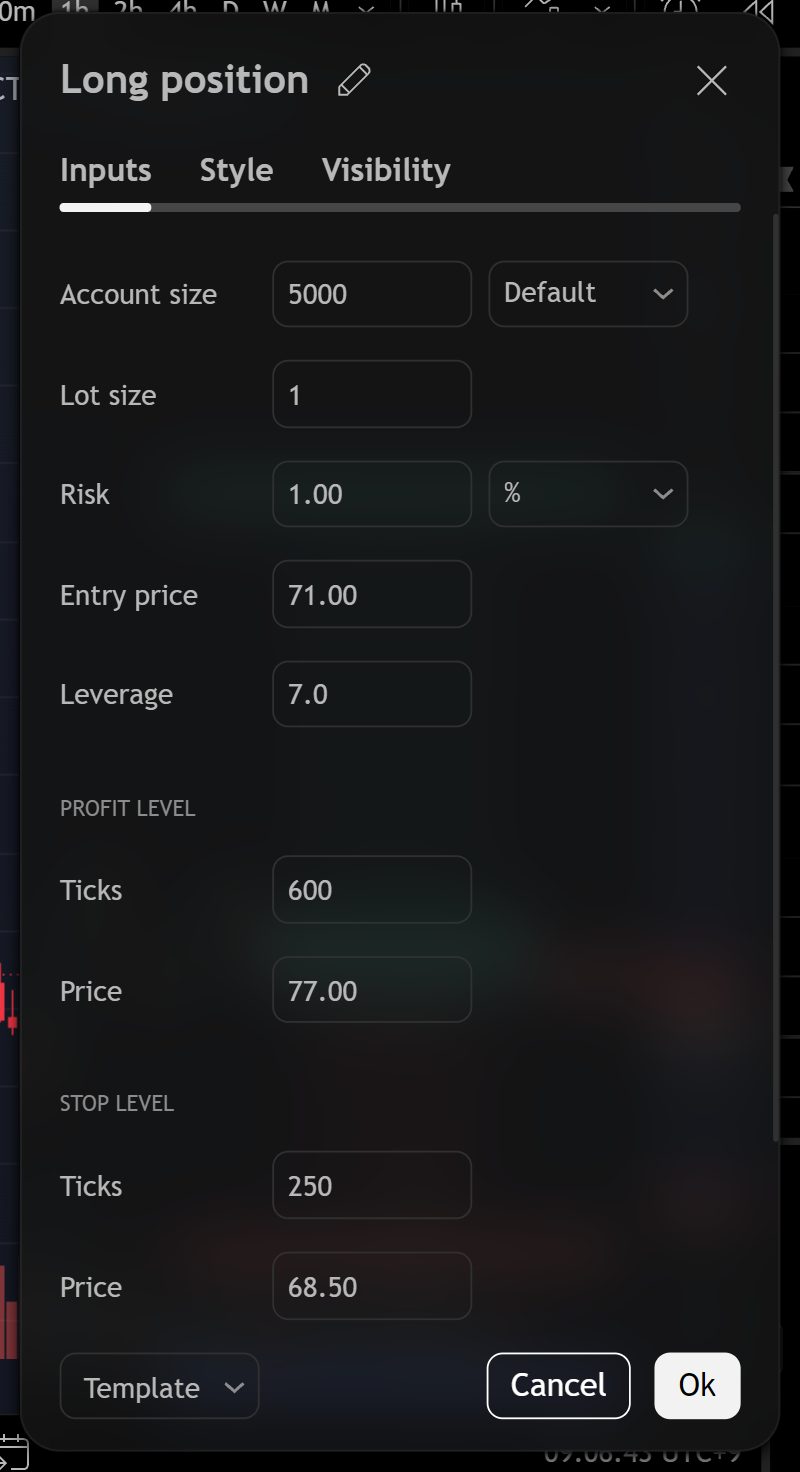
- Double-click the drawing to open its settings. The Inputs tab has Account size, Lot size, Risk (as a % of the account or an absolute amount), Entry price, Leverage, a Profit level and a Stop level in ticks or as a price, and QTY precision (TradingView help).
- Select the drawing and read the labels. They show the quantity (Qty), the account balance if the target or the stop is reached (Amount), the target and stop distances in price, percent and ticks, the risk/reward ratio and the open or closed profit and loss.
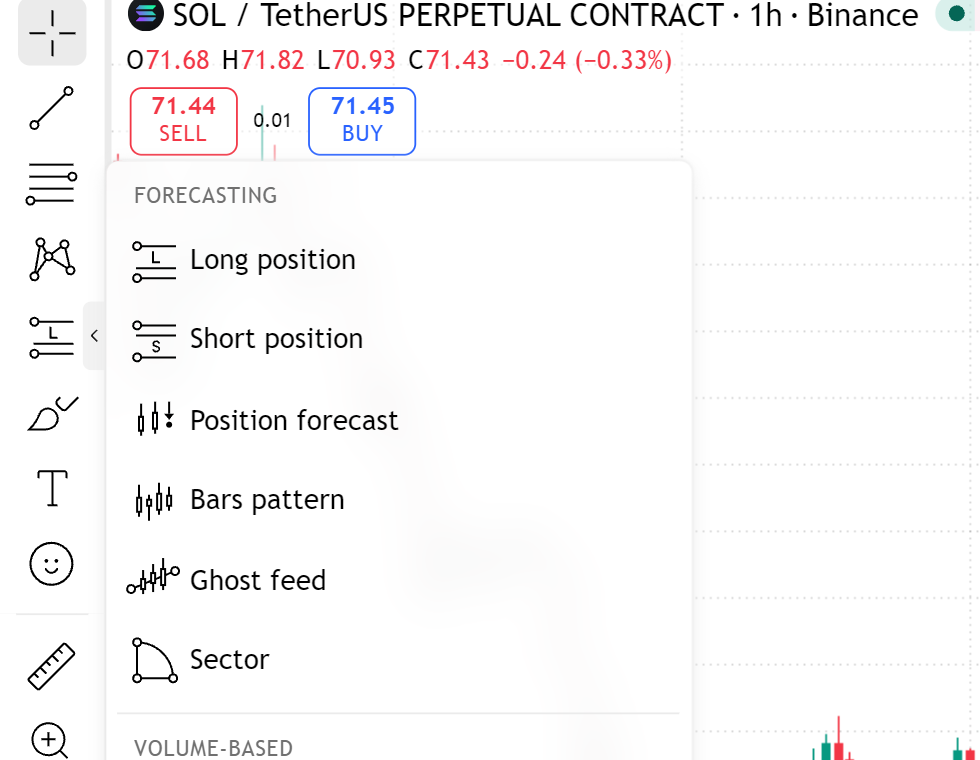
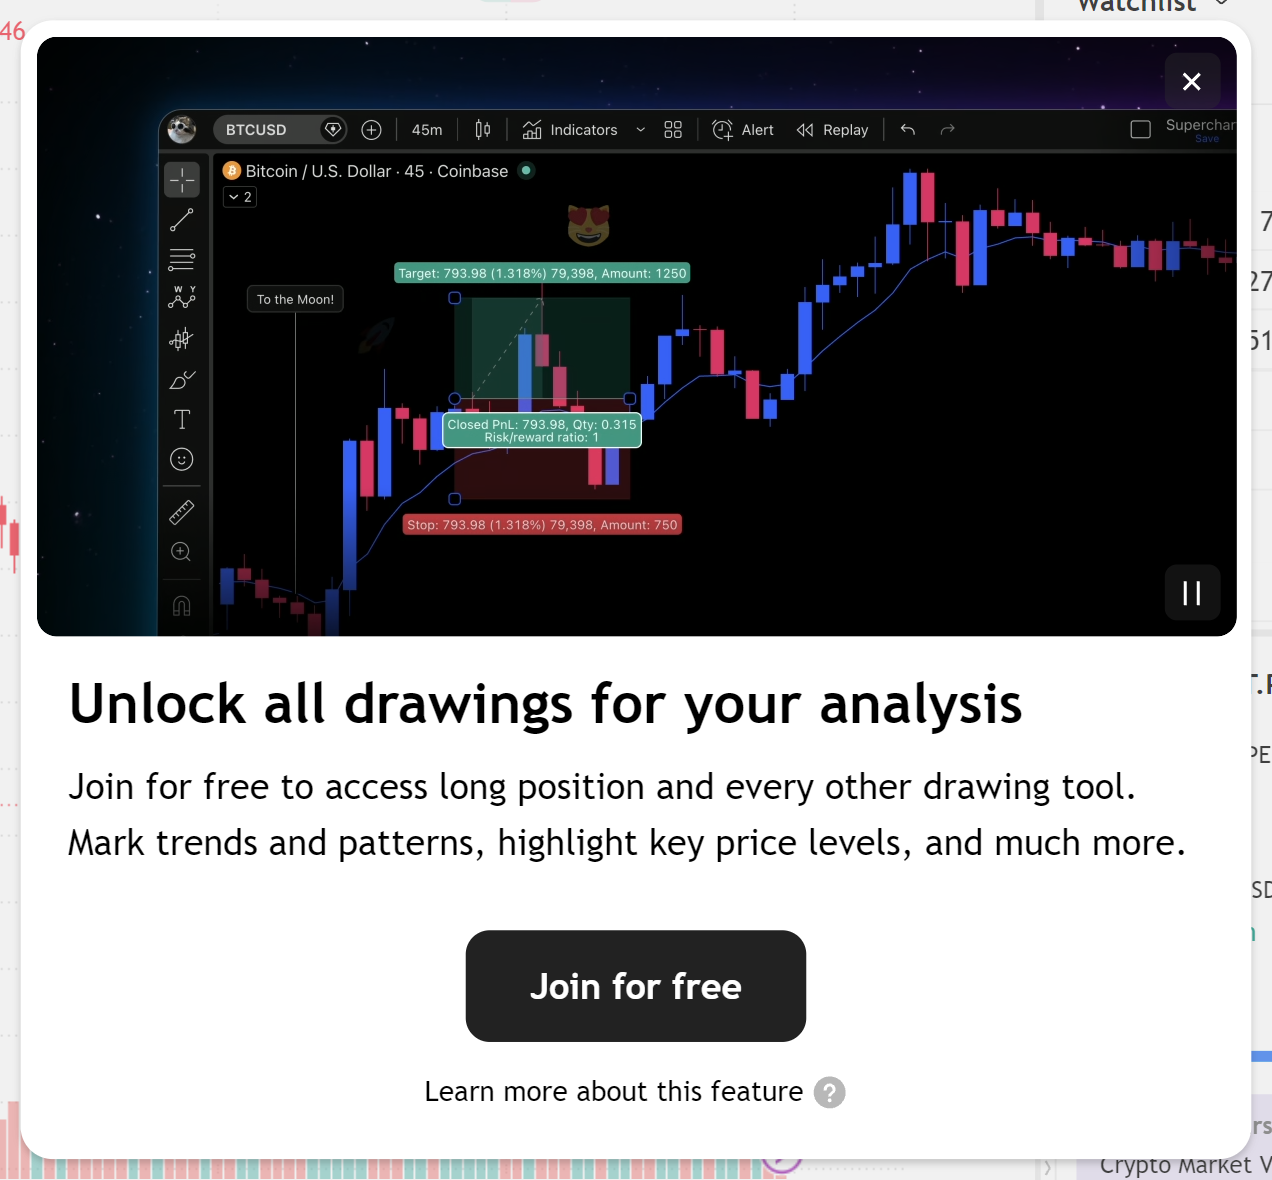
The drawing needs an account. A visitor who is not signed in can open the menu, but choosing Long position brings up a prompt to join.
Signed in, the drawing can be placed and edited. The two screenshots below use the example on this page: account size 5,000, risk 1%, entry 71.00, target 77.00, stop 68.50, leverage 7.
How does TradingView calculate the quantity?
The help article gives the long-position formula below; the short version swaps entry and stop in the distance. The leverage term was added on October 27, 2025 (TradingView blog).
With account size 5,000, risk 1% (50 USDT), entry 71.00, stop 68.50 and leverage 7: QtyRisk = 50 ÷ 2.50 = 20.0000, QtyLvg = 5,000 × 7 ÷ 71 = 492.96, so the tool shows 20.0000. With a target of 77.00 the risk/reward ratio is 2.4.
For a short from 71.00 with a stop at 73.50 the distance is the same 2.50, so the tool gives the same 20.0000. The fee-inclusive quantity is a little lower than for the long, 19.4382, because the closing fee is charged on a higher price.
The same trade with exchange fees
account 5,000 · risk 1% · long 71.00 → stop 68.50 · 7x · market orders · calculated 2026-11-17| Item | TradingView tool | With OKX fees | With Bybit fees | With MEXC fees |
|---|---|---|---|---|
| Quantity | 20.0000 | 19.4571 | 19.4045 | 19.5633 |
| Position size (USDT) | 1,420.00 | 1,381.46 | 1,377.72 | 1,389.00 |
| Margin at 7x (USDT) | 202.86 | 197.35 | 196.82 | 198.43 |
| Loss at the stop, fees included (USDT) | 51.12 to 51.53 | 50.00 | 50.00 | 50.00 |
The gap is small on a wide stop and larger on a tight one, because the fee is charged on the whole position while the risk is measured on the stop distance. To size any trade with fees, maker or taker entries and a liquidation check, use the position size calculator.
What does the tool leave out?
- Trading fees. There is no fee term in the formula. In the example a trade of 20.0000 loses about 51.39 USDT at the stop on OKX, 51.53 on Bybit.
- The liquidation price. The leverage field limits the quantity; it does not show where the exchange closes the position. At 7x isolated on OKX the example is liquidated near 61.19, below the stop. At 25x it is near 68.54, which the price reaches before the 68.50 stop. Check with the liquidation price calculator.
- A quiet cap from the leverage field. A new drawing showed leverage 10000.0, which never binds; once you type your real leverage it can. With a stop at 70.80 and leverage 2, risk ÷ distance is 250.00 but account size × leverage ÷ entry is 140.85. The tool shows 140.85, and the loss at the stop is about 28.17 USDT before fees, not 50.
- Contract units. The formula divides by lot size and multiplies by point value. For a perpetual quoted per coin both are 1; for contracts with a multiplier, set the lot size so the quantity matches what the exchange's order ticket expects.
- Funding and slippage. A stop can fill past its price in a fast market, and funding is paid or received while the position is open: live funding rates.
How do I get an alert at the stop or the liquidation price?
The drawing is a plan on the chart; it does not send orders. A price alert at the same levels tells you when the market gets there.
- Use a price alert. TradingView's alert help says price alerts trigger when the price reaches a level or moves above or below it (introduction to alerts).
- Put one at the stop and one ahead of the liquidation price. In the example that is 68.50 and a level above 61.19.
- Choose where it is delivered. The help lists a pop-up, email, a sound and a webhook URL among the notification options.
- Mind the limits. The pricing page lists 3 active price alerts on the Basic plan (read 2026-11-17), and the help says a standard alert lasts two months at most, with an open-ended option on Premium and Ultimate. Check that older alerts are still running.
Frequently asked questions
Does TradingView have a position size calculator?
Is the Long/Short Position tool free?
Does TradingView's position tool include trading fees?
Why is the quantity in the tool smaller than risk ÷ stop distance?
Does the tool show the liquidation price?
Is there a position size calculator indicator on TradingView?
Sources and limits
TradingView: How to use long and short position drawing tools (settings, labels, formulas), Leverage support in Long and Short Position tools (October 27, 2025), Introduction to TradingView alerts, pricing page; the first two screenshots were taken on 2026-11-17 on a chart opened without signing in, the other two the same day on a signed-in account. Exchange fees: OKX, Bybit, MEXC, regular tier, checked 2026-11-17. The liquidation estimate uses the isolated-margin formulas of our liquidation calculator with the maintenance margin rate you enter (0.5% applies to the smallest position tier). TradingView is a trademark of its owner; this page is an independent explanation. Planning tool, not trading advice. Leveraged futures can lose the whole margin.